Monitoring vs Observability: Logs, Metrics and Traces Explained
Monitoring tells you something is wrong. Observability helps you understand why. Here is how logs, metrics and traces work together to keep applications healthy.
If the first sign of a problem in your application is a customer complaint, you are operating blind. Monitoring and observability are the practices that let you see what your systems are doing, detect issues early and fix them quickly.
Monitoring vs observability
- Monitoring watches known indicators and alerts when they cross thresholds: the site is down, CPU is at 95%, errors exceed 1%. It answers questions you knew to ask in advance.
- Observability is the ability to understand a system's internal state from the data it produces — to investigate new, unexpected problems ("why are checkouts slow only for Android users in one region?") without shipping new code to find out.
You need both: monitoring to know that something is wrong, observability to find out why.
The three pillars
Metrics
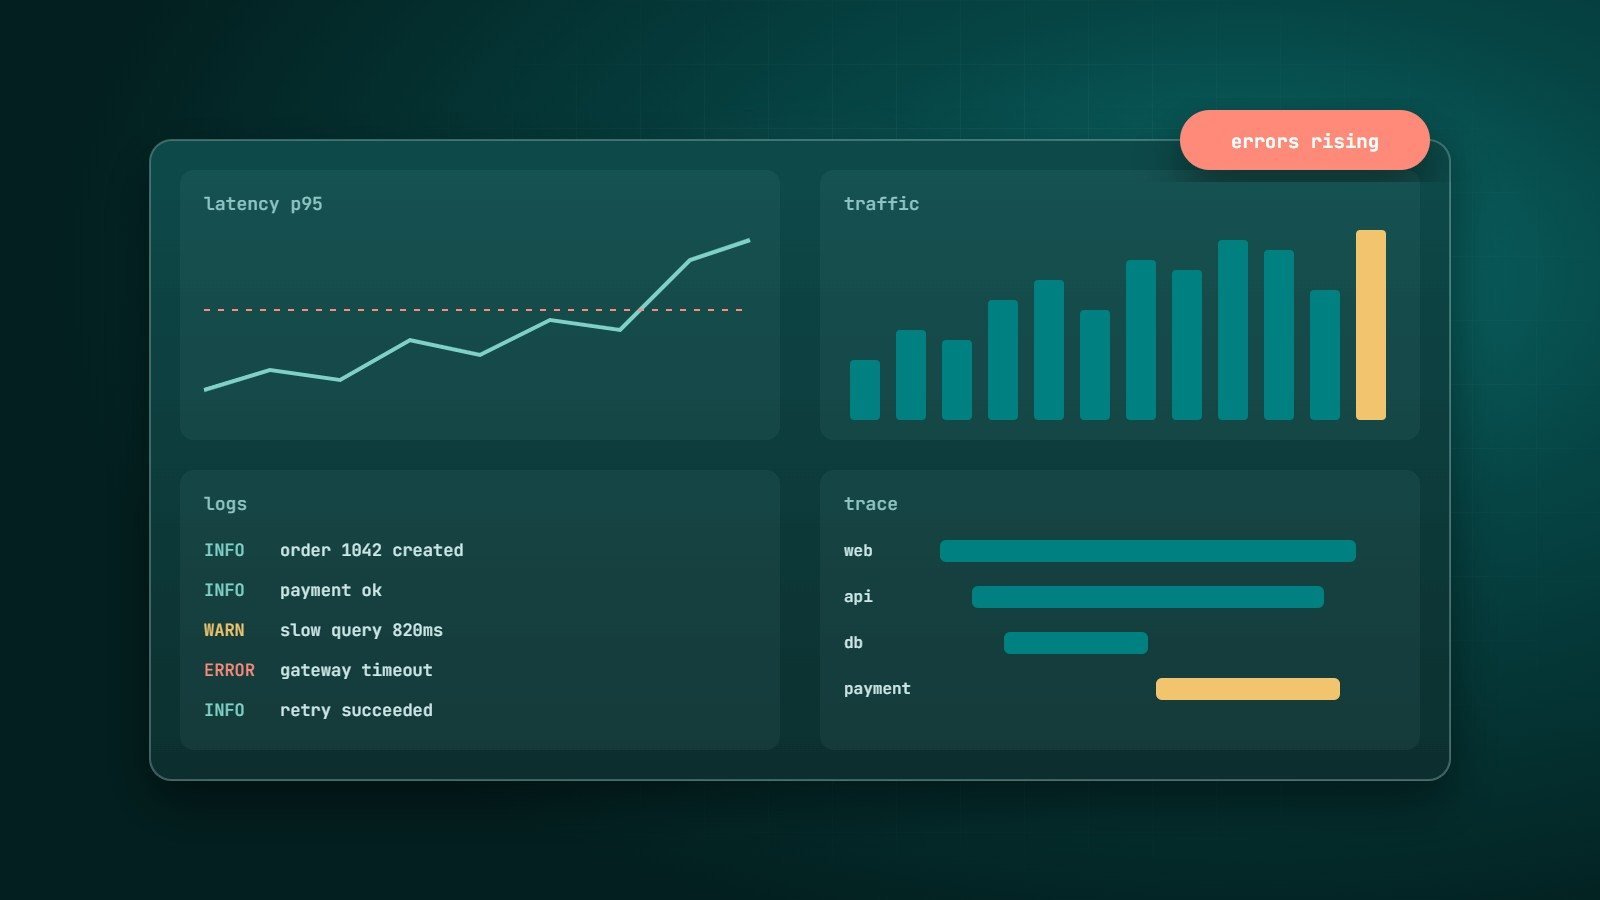
Numbers measured over time: request rate, error rate, response time, CPU, memory, queue length, orders per minute. Metrics are cheap to store, fast to query and ideal for dashboards and alerts. Their limit is detail — they tell you errors rose, not which request failed.
Logs
Timestamped records of events: "payment failed for order 1042: card declined". Logs carry detail and context. Use structured logs (for example JSON with fields like order_id, user_id, duration_ms) so they can be searched and filtered, and never log passwords, card numbers or other sensitive data.
Traces
A distributed trace follows one request through every service it touches — web server, API, database, payment provider — showing how long each step took. Traces answer "where did the time go?" in systems made of many services.
What to measure: the golden signals
Google's Site Reliability Engineering book recommends four golden signals for any user-facing service:
| Signal | Question |
|---|---|
| Latency | How long do requests take? (Look at percentiles like p95 and p99, not only averages.) |
| Traffic | How much demand is there? |
| Errors | What share of requests fail? |
| Saturation | How full are the resources — CPU, memory, disk, connections? |
Add business metrics too — sign-ups, orders, payments. A sudden drop in orders can reveal a problem that technical metrics miss.
Alerting that works
- Alert on symptoms users feel (errors, slowness, downtime), not on every internal cause.
- Every alert must be actionable. If nobody needs to act, it should be a dashboard, not a page.
- Avoid alert fatigue — too many noisy alerts teach people to ignore all of them.
- Link alerts to runbooks describing what to check and how to fix common causes.
SLIs, SLOs and error budgets
- SLI (Service Level Indicator) — a measurement, e.g. the percentage of requests served successfully in under 500 ms.
- SLO (Service Level Objective) — the target for that measurement, e.g. 99.9% over 30 days.
- Error budget — the remaining 0.1%: how much unreliability is acceptable. When the budget is spent, the team prioritises reliability over new features.
Popular tools
- OpenTelemetry — an open standard and set of SDKs for producing metrics, logs and traces in a vendor-neutral way.
- Prometheus (metrics) and Grafana (dashboards) — widely used open-source pair.
- Loki or the Elastic Stack for logs; Jaeger or Tempo for traces.
- Hosted platforms such as Datadog, New Relic, Sentry (errors), and cloud-native tools like AWS CloudWatch, Google Cloud Monitoring and Azure Monitor.
- Simple uptime monitors that check your website from several locations — the minimum every business site should have.
A practical starting point
- External uptime checks with alerts for your website and API.
- Error tracking that captures exceptions with stack traces.
- Dashboards for the four golden signals and key business metrics.
- Structured, centralised logs with request IDs.
- Tracing once you run several services.
Key takeaways
- Monitoring detects known problems; observability helps explain unknown ones.
- Metrics, logs and traces each answer different questions — use them together.
- Measure latency, traffic, errors and saturation, plus business metrics.
- Alert on user-facing symptoms, and make every alert actionable.
How Wintecsys can help
We set up uptime monitoring, error tracking, logging, dashboards and alerts for websites and applications — and can watch them for you as part of ongoing maintenance.